
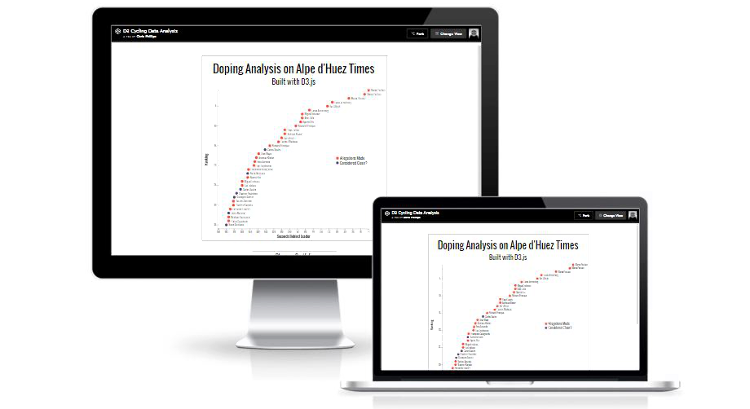
Using D3 to bind data to the DOM, this scatter graph shows the times of top riders on the climb of Alpe D'Huez in the Tour De France. The riders are color coordinated by doping allegations and a tooltip is produced when hovered over to display the type of allegations that have been made against the rider. Animation is used on startup for a great introductory effect, as well as a key so the styling is easily understood by the user. The data comes from a JSON API endpoint.
Features
- D3JS scatter graph based on using JSON data.
- Data and tooltips generated from JSON data object.
- D3 animations for transitions on start and on hover.
- Simple to understand user interface with clear key.